> ## Documentation Index
> Fetch the complete documentation index at: https://docs.uniblock.dev/llms.txt
> Use this file to discover all available pages before exploring further.
# API Logs
> API logs are crucial for understanding the behavior, performance, and health of your applications.
Here, we guide you through how Uniblock provides detailed logging and how you can access and interpret these logs for optimal API performance.
## Why API Logs Matter? 🧐
API logs offer visibility into the operation of your application. By analyzing API logs, you can:
* Identify and diagnose issues.
* Monitor API health and performance.
* Track user activity and patterns.
* Ensure security by detecting malicious activities.
## Reading the Logs 📖
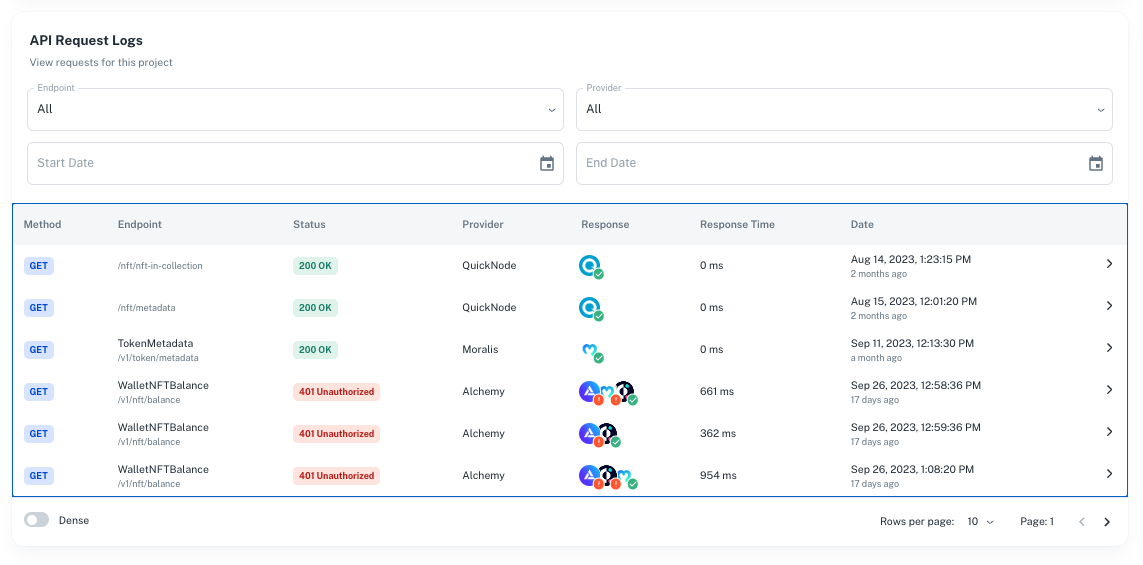 Each log entry provides a number of requests made to external provider according to fallback list and the request detail of them:
* **Method**: the http request method, such as `GET` or `POST`.
* **Endpoint**: Which API endpoint was accessed.
* **Status**: Success or error status code.
* **Provider**: The provider that provided the final response.
* **Response**: The provider(s) responses that attempted the API call.
* **Response Time**: How long the API took to respond, also as known as latency.
* **Date**: The date and time when the request was made.
## Detailed API Request Logs 📝
Each log entry provides a number of requests made to external provider according to fallback list and the request detail of them:
* **Method**: the http request method, such as `GET` or `POST`.
* **Endpoint**: Which API endpoint was accessed.
* **Status**: Success or error status code.
* **Provider**: The provider that provided the final response.
* **Response**: The provider(s) responses that attempted the API call.
* **Response Time**: How long the API took to respond, also as known as latency.
* **Date**: The date and time when the request was made.
## Detailed API Request Logs 📝
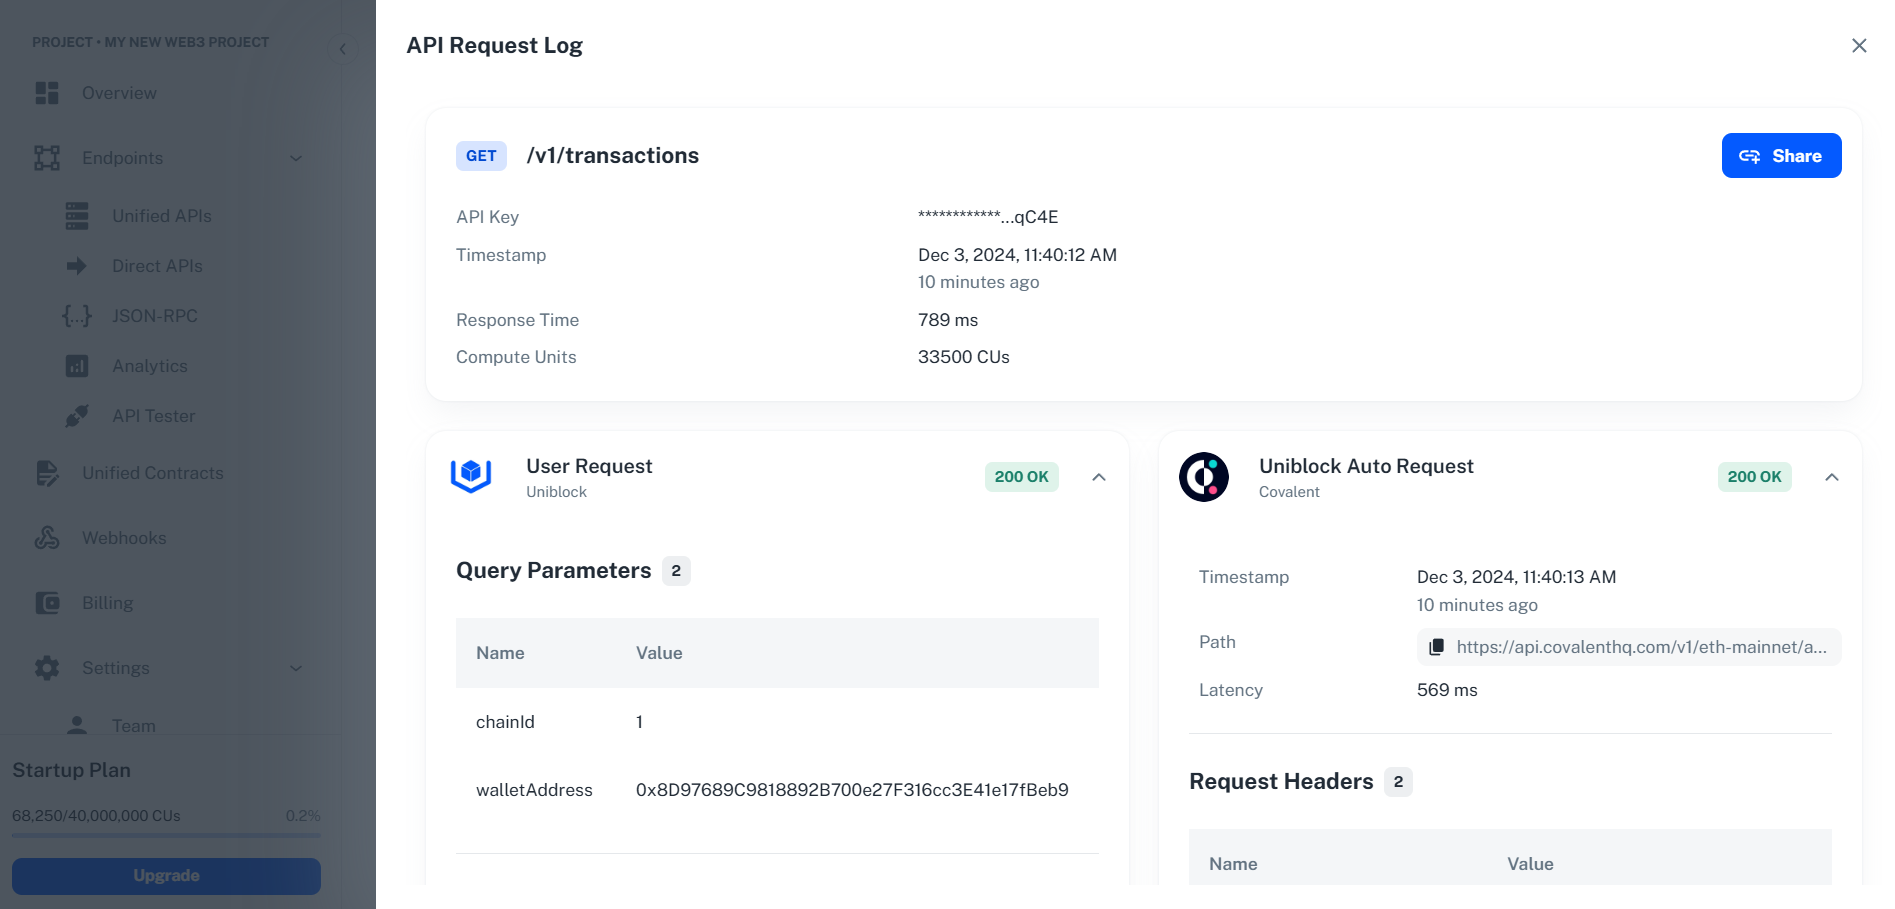 Clicking into a log entry provides in-depth log information for each API request to provide a transparent view into the interactions between your application and our system, as well as a series of requests attempted with external provider according to the fallback list. Here's a breakdown of the key components in our detailed logs for each request:
* **HTTP Method**: Such as `GET`, indicating the type of request made.
* **Endpoint Name**: A brief descriptor like `TokenMetadata` offering context on the purpose of the request.
* **Endpoint Path**: The specific path like `/v1/token/metadata` accessed on our servers.
* **Timestamp**: The exact time when the request was made.
* **Response Time**: Duration taken by our server to process and respond to the request.
* **Headers**: These are meta-data associated with the request. It includes various fields like:
* `Host`: The domain making the request.
* `User-Agent`: Information about the client system and browser.
* `Accept`: The type of content expected in response.
* ... and many others.
* **Query Parameters**: These are additional data sent with the request to provide context or specify a certain behavior.
* **Request Body**: The actual data sent in a `POST` or `PUT` request.
* **Response Headers & Body**: Meta-data and actual data returned from our provider(s) in response to the request. There may be multiple in the case that priority list gets engaged.
Clicking into a log entry provides in-depth log information for each API request to provide a transparent view into the interactions between your application and our system, as well as a series of requests attempted with external provider according to the fallback list. Here's a breakdown of the key components in our detailed logs for each request:
* **HTTP Method**: Such as `GET`, indicating the type of request made.
* **Endpoint Name**: A brief descriptor like `TokenMetadata` offering context on the purpose of the request.
* **Endpoint Path**: The specific path like `/v1/token/metadata` accessed on our servers.
* **Timestamp**: The exact time when the request was made.
* **Response Time**: Duration taken by our server to process and respond to the request.
* **Headers**: These are meta-data associated with the request. It includes various fields like:
* `Host`: The domain making the request.
* `User-Agent`: Information about the client system and browser.
* `Accept`: The type of content expected in response.
* ... and many others.
* **Query Parameters**: These are additional data sent with the request to provide context or specify a certain behavior.
* **Request Body**: The actual data sent in a `POST` or `PUT` request.
* **Response Headers & Body**: Meta-data and actual data returned from our provider(s) in response to the request. There may be multiple in the case that priority list gets engaged.
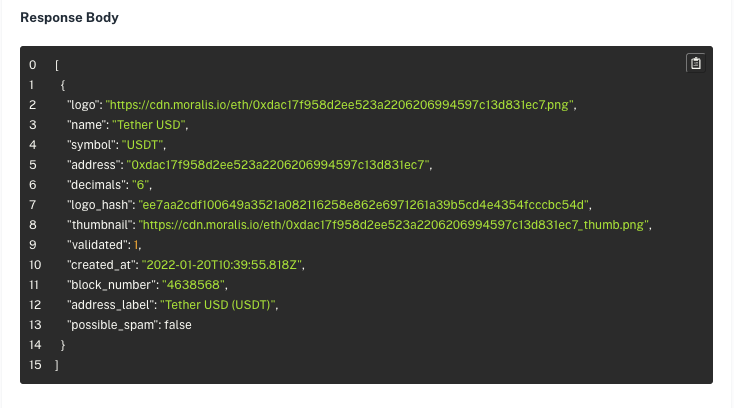 By diving deep into these logs, developers can quickly troubleshoot, optimize, and secure their application's interactions with Uniblock.
## Filtering and Searching 🔍
Use the filter options to narrow down logs based on specific criteria, such as providers, status codes, endpoints, or time frames. The search bar allows you to quickly find logs containing specific keywords or error messages.
***
Create your free account and start building with unified blockchain infrastructure across 100+ chains.
Explore all available endpoints and interactive playgrounds
Get help from our team and connect with other developers
By diving deep into these logs, developers can quickly troubleshoot, optimize, and secure their application's interactions with Uniblock.
## Filtering and Searching 🔍
Use the filter options to narrow down logs based on specific criteria, such as providers, status codes, endpoints, or time frames. The search bar allows you to quickly find logs containing specific keywords or error messages.
***
Create your free account and start building with unified blockchain infrastructure across 100+ chains.
Explore all available endpoints and interactive playgrounds
Get help from our team and connect with other developers