Analytics

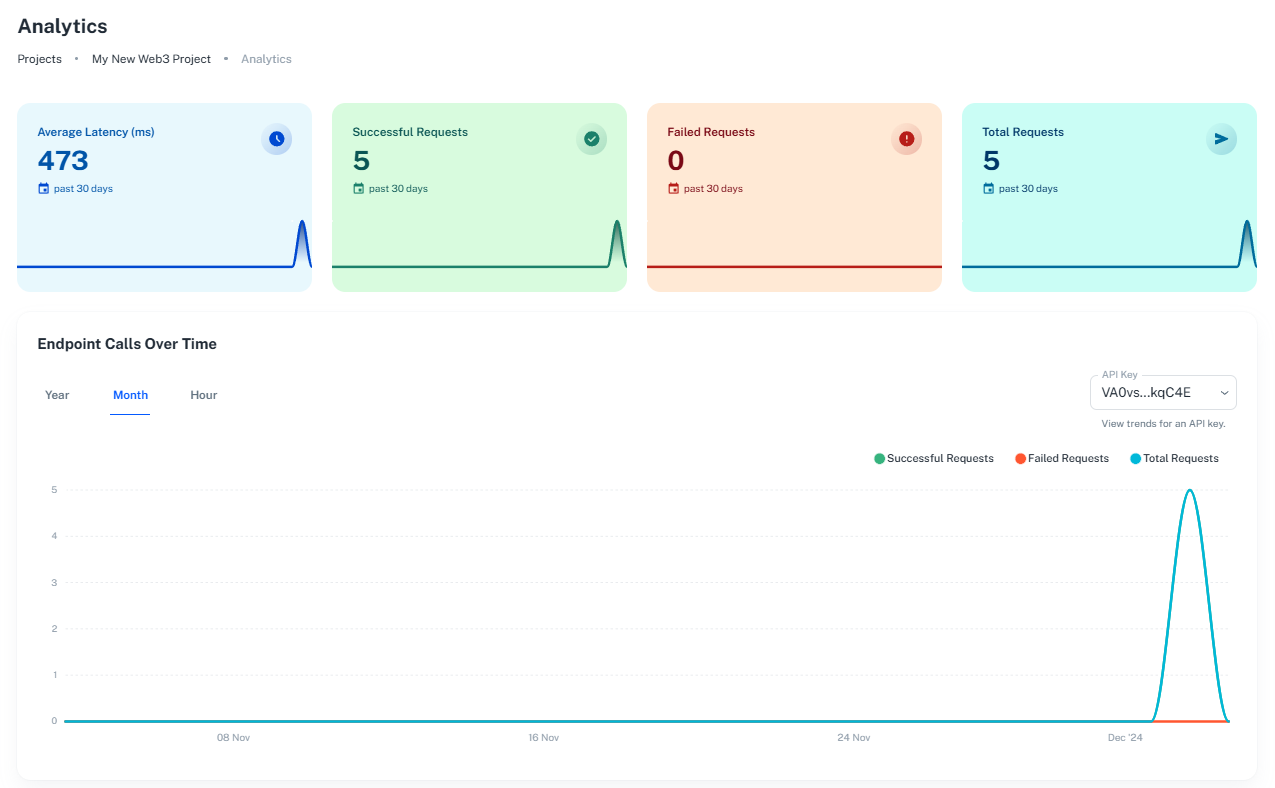
The Endpoints -> Analytics is your hub for in-depth understanding of your project's performance and usage. It provides critical statistics about response times, requests, and total usage.
Logs
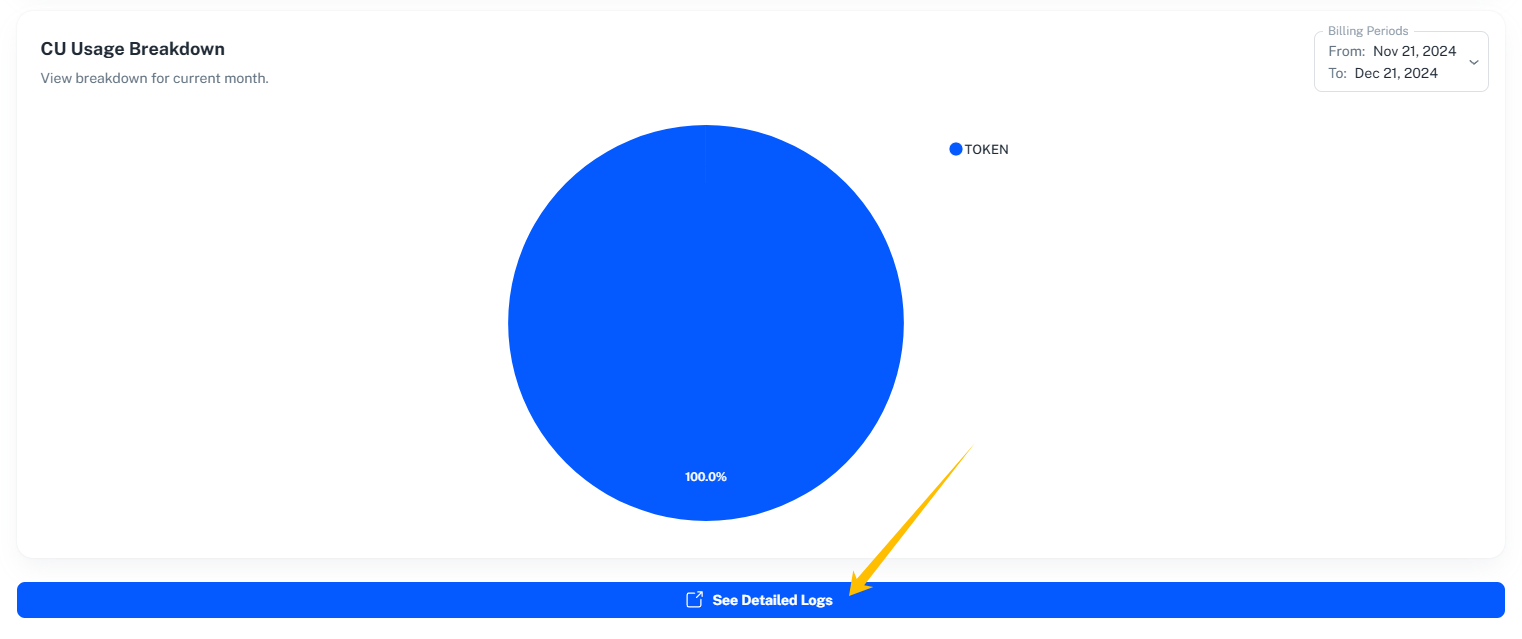
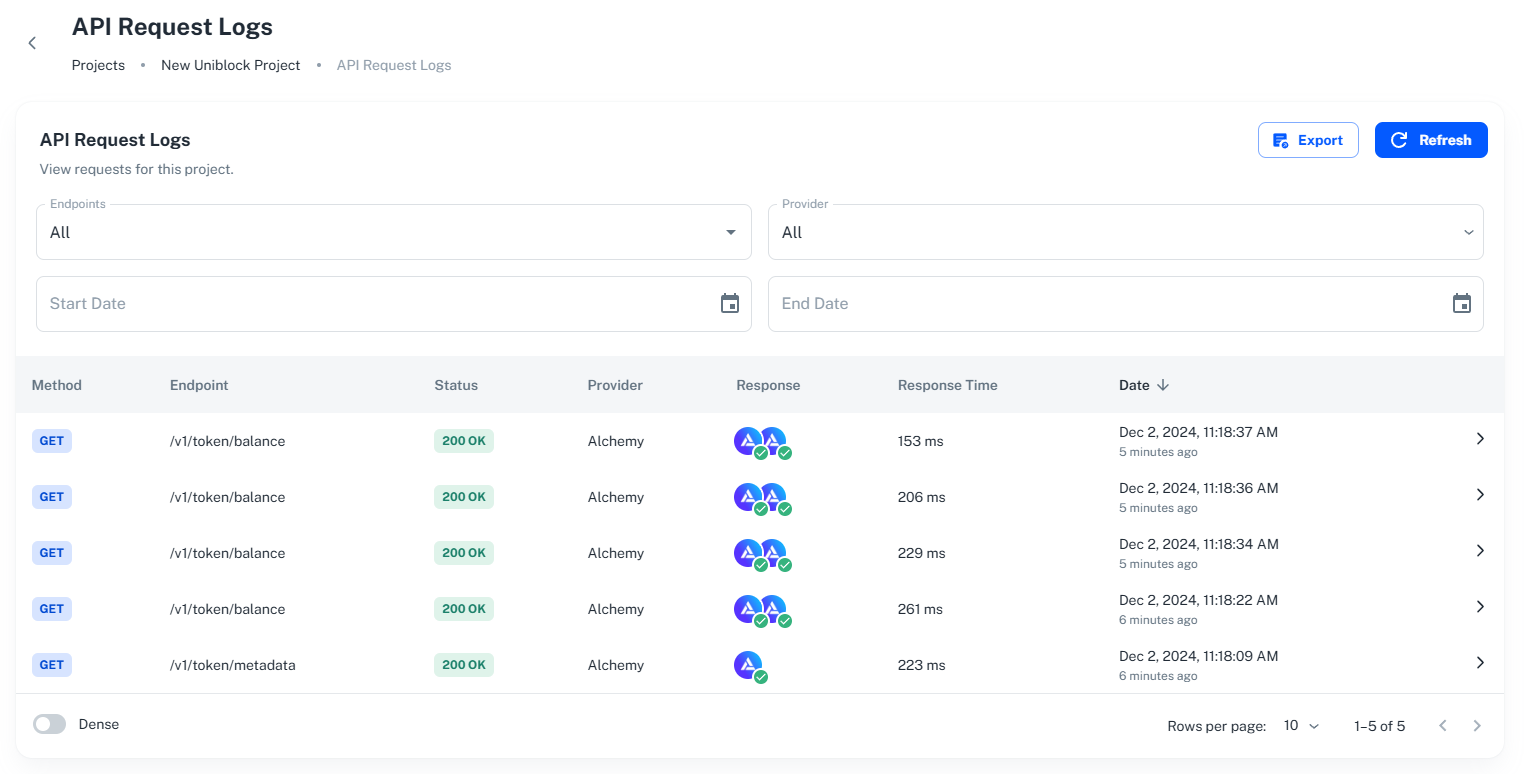
- Scroll down to See Detailed Logs to view detailed information for each call, such as request type, timestamp, response time, headers, and much more.


API Logs Table
Understanding your project's Statistics
Uniblock Analytics provides the following statistical data for your project:
-
Average Latency: This metric indicates the average amount of time your project's API takes to respond to requests. It is an essential performance indicator, as a lower response time contributes to a smoother user experience.
-
Successful Requests: This count is the number of successful requests made.
-
Failed Requests: This count provides the number of requests that encountered an error or did not complete successfully.
-
Total Requests: This is the cumulative number of requests made to your project's API. Tracking this helps gauge your project's activity and usage patterns.
-
Endpoint Calls Over Time: This chart provides visualized data of successful requests, failed requests, and total requests over time.
API Key Analytics
In addition to project-wide analytics, Uniblock also provides statistics for each API key. For each of your API keys, you can view the same set of metrics: average response time, failed requests, total requests, and total usage.
This feature lets you analyze how each API key is being used, and could be crucial in identifying any anomalies or discrepancies tied to a specific API key.
Harness the power of Uniblock's Analytics to understand your project's performance, optimize it, and provide a superior experience for your users. If you have any questions or require assistance with Uniblock's Analytics, feel free to reach out to our support team.
Updated 11 months ago
API logs to see detailed information on the calls made using the project's API key.